Trading · BraivIQ AI Engineering Playbook
Building A Real-Time Trading Blotter And P&L Dashboard In Code: Live Positions, Orders, Fills And Profit-And-Loss That Never Lie
Ask a trader what they stare at all day and it is not a candlestick chart - it is the blotter: the live, constantly-updating view of their orders, fills, positions and profit-and-loss. It is the single most important screen in trading, because it is where a trader sees, in real time, what they hold, what is working, what is filling, and whether they are making or losing money right now. Building one that is fast, correct and readable under a live market is a deceptively hard and highly specialised job - and one where a subtle bug doesn't just look wrong, it shows a trader the wrong P&L, which is dangerous. This is a domain BraivIQ specialises in, and this playbook covers how a real-time trading blotter and P&L dashboard actually works in code: the data behind it, the calculations that must be exactly right, and the rendering that keeps it live and legible.
· 12 min read · By BraivIQ Engineering
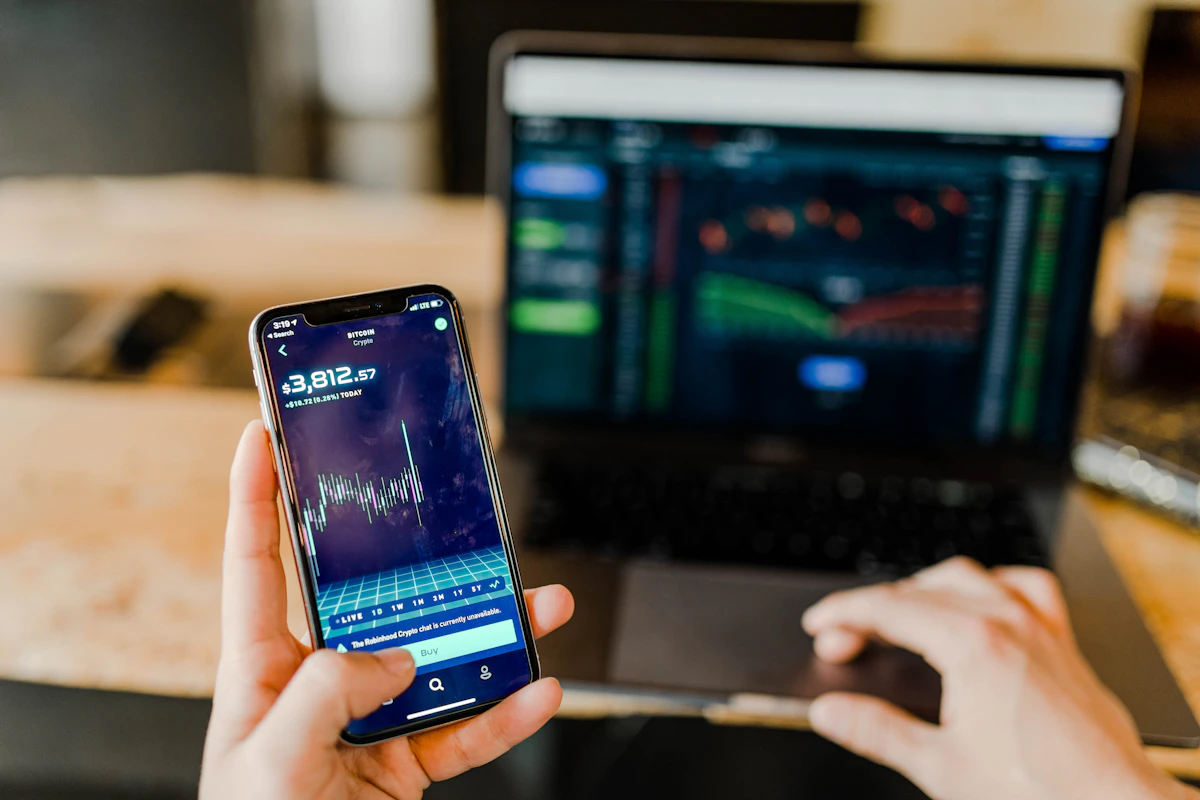
The main screen - The blotter - live orders, fills, positions and P&L - is the screen traders actually watch all day · Exactly right - P&L and position calculations must be precisely correct - a subtle bug shows a trader the wrong money · Live - It updates in real time as fills arrive and prices move, without stutter, hours on end · Legible under pressure - Dense, fast-changing information that a trader must read instantly - readability is a hard requirement
There is a common misconception that the screen a trader lives on is a price chart. It usually is not. The screen a trader actually stares at all day is the blotter: the live, constantly-updating view of their orders, their fills, their positions, and their profit-and-loss. It is, for most traders, the single most important interface in their world, because it answers the questions that matter most, continuously and in real time - what do I hold right now, what orders are working, what is filling, what is my exposure, and am I making or losing money at this moment? A candlestick chart tells you about the market. The blotter tells you about you - your actual state in that market, live. Building a real-time trading blotter and P&L dashboard that is fast, correct and readable under a live market is a deceptively hard and highly specialised piece of engineering, and it carries a unique danger: a subtle bug here does not merely look wrong, it shows a trader the wrong P&L or the wrong position, on which they may act - which is a serious problem. This is a domain BraivIQ specialises in, and this playbook is how it actually works in code.
The Data Behind The Blotter
A blotter is a live synthesis of several real-time data streams, and getting that synthesis right is the foundation everything else rests on. It needs the order and fill data: what orders exist, their state (working, partially filled, filled, cancelled), and every fill as it happens - typically flowing from the order/execution system as events. It needs the position data: the net result of all fills, aggregated into current positions per instrument - which is itself derived by correctly accumulating fills. And it needs live market prices: because P&L and the current value of positions depend on where the market is right now, the blotter must consume a live price feed and revalue continuously as prices move. The blotter's job is to keep all of this synthesised into one coherent, current picture: as a fill arrives, the position updates and the P&L recomputes. As a price ticks, the mark-to-market value and unrealised P&L update. That means the blotter is fed by a continuous flow of order/fill events and price updates, and must maintain a correct, live-updating model of orders, positions and P&L from them. The correctness of that model is paramount, because everything the trader sees and acts on comes from it - which is why the calculations behind it cannot be even slightly wrong.
The Calculations That Must Be Exactly Right
The heart of a blotter, and the part where correctness is non-negotiable, is the calculation of positions and P&L. Positions must be computed by correctly accumulating fills - net quantity, average price - which sounds simple and is full of subtle traps around partial fills, buys and sells, and edge cases that must all be handled exactly. P&L is where it gets genuinely demanding: realised P&L (the profit or loss locked in by closed trades) and unrealised P&L (the paper profit or loss on open positions, which changes every time the market moves) must both be computed correctly, marking open positions to the current market price continuously. Getting the conventions right - how average price is computed, how realised versus unrealised is split, how the current mark is applied - is essential, because a trader makes real decisions based on these numbers, and a wrong P&L is worse than no P&L: it is misinformation the trader may act on. This is why a blotter's calculation logic demands the same rigour as any financial system: it must be correct to the convention and the cent, thoroughly tested against known cases, and trustworthy, because the entire value of the blotter is that the trader can rely on the numbers it shows. Beautiful rendering on top of wrong calculations is not a nice dashboard - it is a dangerous one.
Rendering It Live And Legible
With the data synthesised and the calculations correct, the rendering job is to present a dense, fast-changing picture that a trader can read instantly and that updates in real time without stutter. The blotter is typically a set of live tables and figures - the orders and their states, the positions with their sizes and prices, the P&L broken down and totalled - all updating continuously as fills arrive and prices tick. The engineering echoes other real-time trading interfaces: decouple the data (the flow of fills and price updates maintaining the model) from the rendering (drawing the current state on screen), and update efficiently - re-render only what changed (the rows and figures that updated) rather than redrawing everything on every tick, so it stays smooth under a heavy flow. And it demands a specific kind of legibility: the information is dense and changes fast, and a trader must be able to read their state - especially their P&L and key positions - at a glance and under pressure, so clear, stable, well-organised presentation is a hard requirement, not a nicety, because a blotter that is correct but unreadable, or that flickers distractingly as it updates, fails at its job of giving the trader instant situational awareness. Getting the real-time rendering both smooth and legible, on top of correct calculations, is what makes a blotter genuinely usable - and it is exactly the kind of demanding real-time trading-interface engineering BraivIQ builds.
The Bottom Line
The real-time trading blotter and P&L dashboard - not the price chart - is the screen traders actually live on, because it shows them their own live state in the market: their orders, fills, positions and profit-and-loss, updating continuously. Building one well is a specialised and deceptively hard engineering job with a unique danger, because a subtle bug shows a trader wrong numbers they may act on. Doing it right means synthesising the live order, fill and price data into one coherent, current model. Computing positions and P&L - realised, unrealised, mark-to-market - exactly correctly, with the rigour a financial system demands, because a wrong P&L is dangerous misinformation, and rendering the dense, fast-changing result live and legibly, decoupling data from rendering and updating only what changed so it stays smooth and readable under a heavy market. It is one of the most important interfaces in trading and exactly the kind of correctness-critical, real-time trading-charts and dashboard engineering BraivIQ specialises in - because the blotter is only useful if the trader can trust, at a glance, every number it shows. Educational engineering guidance only - not financial advice.
References & Further Reading
- Databento Microstructure Guide - order management systems and the trade lifecycle: https://databento.com/microstructure/oms
- Investopedia - profit and loss (P&L) and mark-to-market explained: https://www.investopedia.com/terms/p/plstatement.asp
- AG Grid - high-performance data grids for real-time financial dashboards: https://www.ag-grid.com/
- SciChart - real-time JavaScript charts for trading dashboards (WebGL/WebAssembly): https://www.scichart.com/blog/fastest-chart-libraries-for-quantitative-analysis/
- Quod Financial - what is an O/EMS? (the systems a blotter draws its data from): https://www.quodfinancial.com/what-is-an-o-ems-a-complete-guide-to-order-execution-management-systems/