Trading · BraivIQ AI Engineering Playbook
Trade Surveillance AI In Code: Triage Alerts With An Analyst In The Loop And Chart The Evidence
Trade surveillance AI earns its place in alert triage, not in the final decision. It assembles the evidence for each alert, orders the queue by how often similar alerts were escalated in the past, and shows the analyst a chart of prices and the trader's orders, while a named analyst still decides every alert. On 22 September 2026 the FCA's chief executive said the regulator is exploring agentic AI as its "first responder" for wholesale market monitoring, and on 16 September TradingView published the first official plugin packages for Lightweight Charts. This playbook builds the triage pipeline in Python and the evidence chart in TypeScript, with sample data only.
Published · Updated · 12 min read · By BraivIQ Engineering

Key takeaways
- The FCA's chief executive said on 22 September 2026 that the regulator is "exploring agentic AI as our 'first responder'" to speed up wholesale market monitoring, working with about a billion rows of data a day.
- In a firm's own surveillance, AI is most defensible as a triage layer: it builds the evidence pack and orders the queue, and a named analyst records every disposition.
- Order the queue by escalation rates measured on your analysts' past decisions, not by a vendor score or a model's raw confidence, and send a sample of batch closures to second review.
- TradingView's first official Lightweight Charts plugin packages, released on 16 September 2026, include a vertical-line plugin that marks the alert window on the evidence chart. The library itself stays at 5.2.1.
- The Python sample was run on Python 3.14.4 and 3.11.14 and passes
mypy --strict. The chart passes strict type-checking with TypeScript 7.0.2 and was rendered in Chrome from the Python sample's output.
22 Sep 2026 - FCA chief executive: the regulator is exploring agentic AI as a "first responder" for wholesale market monitoring · 1 billion - Rows of data a day the FCA says it works with on market abuse · 16 Sep 2026 - First official Lightweight Charts plugin packages, including a vertical-line plugin · 0 - Alerts closed by the AI in this design. Every one ends with a named analyst
Surveillance teams in UK trading firms do not lack alerts. They lack hours. Trade surveillance AI earns its place by doing the slow, repetitive part of the job: assembling the orders, cancels and fills behind each alert, putting the alerts most likely to need escalation at the top of the queue and drawing the evidence so an analyst can judge it in seconds. The analyst still decides every alert, and that is the line this playbook holds throughout.
It is engineering content for developers who build surveillance tooling at trading firms, brokers and banks. It gives no view on any trading strategy, and all market data in the samples is generated sample data.
What did the FCA say about AI in market surveillance in September 2026?
At a TheCityUK dinner on 22 September 2026, published on 23 September, FCA chief executive Nikhil Rathi said: "We are already exploring agentic AI as our 'first responder' to speed up how we monitor wholesale markets". He described the regulator using its "large data sets – a billion rows of data per day – alongside our supervisory judgement" to tackle market abuse faster. The FCA notes that the published text is the drafted speech and may differ from what was delivered.
The phrase that matters for firms is "alongside our supervisory judgement". The regulator is describing AI that speeds up the first look and people who make the call. That is the same split we recommend inside a firm, and it is the design in this playbook.
What does a trading workflow architecture for alert triage look like?
Your existing surveillance system keeps raising alerts. A read-only replica of order and trade data feeds an evidence builder. A prioritiser, either transparent points or a decision model, scores each alert and is calibrated on past dispositions. Analysts work the queue in that order with an evidence chart beside each alert. A sample of quick closures goes to a second analyst, escalations go to compliance, and every decision is written to an audit log with a hash of the evidence the analyst saw.
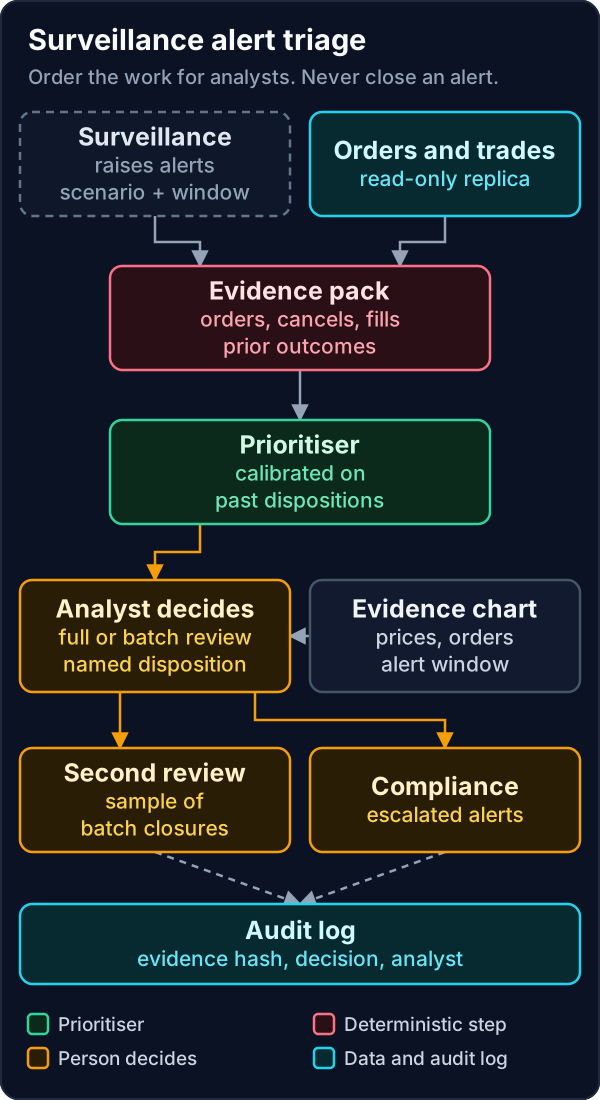
This trading workflow architecture deliberately leaves detection to the system you already run. Our earlier playbook on AI trade surveillance and explainable alerts covers detection. Triage is a separate problem with a separate risk profile, and keeping it separate means you can change the prioritiser without touching the scenarios your compliance team has signed off.
How do you build the evidence pack and order the analyst queue in Python?
The first sample is standard-library Python. We ran it on Python 3.14.4 and 3.11.14 and it passes mypy --strict. It builds evidence for each alert, converts it to a transparent priority bucket, turns each bucket into an escalation rate measured on past dispositions, orders the queue and records a named analyst's decision with a hash of the evidence.
alert_triage.py"""Surveillance alert triage: build the evidence, order the analyst queue, keep every disposition with a person.
Python 3.11+, standard library only. Orders, prices and alert history are sample data.
The prioritiser decides the order in which analysts see alerts. It never closes one.
"""
from __future__ import annotations
import hashlib
import json
import random
from dataclasses import asdict, dataclass
from datetime import datetime, timedelta, timezone
from statistics import median
from typing import Literal
@dataclass(frozen=True)
class Alert:
alert_id: str
scenario: str # raised by your existing surveillance system
trader_id: str
isin: str
start: datetime
end: datetime
@dataclass(frozen=True)
class Order:
order_id: str
trader_id: str
isin: str
side: Literal["buy", "sell"]
price: float
qty: int
placed: datetime
cancelled: datetime | None
filled_qty: int
@dataclass(frozen=True)
class Evidence:
alert_id: str
orders: int
cancel_ratio: float
median_life_s: float
opposite_side_filled: int
prior_escalations: int
def build_evidence(alert: Alert, orders: list[Order], escalations_by_trader: dict[str, int]) -> Evidence:
window = [o for o in orders if o.trader_id == alert.trader_id and o.isin == alert.isin
and alert.start <= o.placed <= alert.end]
cancelled = [o for o in window if o.cancelled is not None]
lives = [(o.cancelled - o.placed).total_seconds() for o in cancelled if o.cancelled]
sell_heavy = sum(o.qty for o in window if o.side == "sell") >= sum(o.qty for o in window if o.side == "buy")
opposite = sum(o.filled_qty for o in window if o.side == ("buy" if sell_heavy else "sell"))
return Evidence(alert.alert_id, len(window), round(len(cancelled) / max(len(window), 1), 3),
round(median(lives), 2) if lives else 0.0, opposite, escalations_by_trader.get(alert.trader_id, 0))
def bucket(e: Evidence) -> int:
"""Transparent points, so an analyst can see why an alert sits where it does. 0 (low) to 3 (high)."""
points = (2 if e.cancel_ratio >= 0.8 else 0) + (2 if e.median_life_s < 3 else 0) \
+ (2 if e.opposite_side_filled > 0 else 0) + (1 if e.prior_escalations > 0 else 0)
return min(points // 2, 3)
def calibrate(history: list[tuple[int, bool]]) -> dict[int, float]:
"""Escalation rate per bucket from analysts' past dispositions, with add-one smoothing."""
return {b: (sum(esc for bb, esc in history if bb == b) + 1) / (sum(1 for bb, _ in history if bb == b) + 2)
for b in range(4)}
@dataclass(frozen=True)
class QueueItem:
alert_id: str
bucket: int
p_escalation: float
review: Literal["full review", "batch review"]
evidence: Evidence
def build_queue(alerts: list[Alert], orders: list[Order], escalations: dict[str, int],
rates: dict[int, float], full_review_from: float = 0.15) -> list[QueueItem]:
items = []
for a in alerts:
e = build_evidence(a, orders, escalations)
b = bucket(e)
items.append(QueueItem(a.alert_id, b, rates[b], "full review" if rates[b] >= full_review_from else "batch review", e))
return sorted(items, key=lambda i: i.p_escalation, reverse=True)
def record_disposition(item: QueueItem, analyst_id: str, decision: Literal["close", "escalate"], reason: str,
log: list[dict[str, object]], qa_rate: float = 0.10) -> dict[str, object]:
"""Every alert ends with a named analyst's decision. A share of batch closures goes to second review."""
evidence_digest = hashlib.sha256(json.dumps(asdict(item.evidence), sort_keys=True).encode()).hexdigest()
qa = decision == "close" and item.review == "batch review" and \
int(hashlib.sha256(item.alert_id.encode()).hexdigest(), 16) % 100 < qa_rate * 100
entry: dict[str, object] = {"ts": datetime.now(timezone.utc).isoformat(), "alert_id": item.alert_id, "analyst": analyst_id,
"decision": decision, "reason": reason, "bucket": item.bucket,
"p_escalation": round(item.p_escalation, 3), "evidence_sha256": evidence_digest,
"second_review": qa}
log.append(entry)
return entry
def chart_payload(alert: Alert, orders: list[Order], seed: int = 3) -> dict[str, object]:
"""Evidence for the analyst's chart: one-minute candles (sample prices) and this trader's orders."""
rng, price, candles = random.Random(seed), 101.10, []
for m in range(-10, 21):
t = alert.start + timedelta(minutes=m)
o = price
price = round(price + rng.uniform(-0.05, 0.05), 2)
candles.append({"time": int(t.timestamp()), "open": o, "high": round(max(o, price) + 0.02, 2),
"low": round(min(o, price) - 0.02, 2), "close": price})
mine = [o for o in orders if o.trader_id == alert.trader_id and o.isin == alert.isin]
return {"alert": {"id": alert.alert_id, "scenario": alert.scenario, "start": int(alert.start.timestamp()),
"end": int(alert.end.timestamp())},
"candles": candles,
"orders": [{"id": o.order_id, "side": o.side, "price": o.price, "qty": o.qty,
"time": int(o.placed.timestamp()) // 60 * 60, "cancelled": o.cancelled is not None,
"filled": o.filled_qty} for o in mine]}
def sample_data(seed: int = 11) -> tuple[list[Alert], list[Order], dict[str, int], list[tuple[int, bool]]]:
rng = random.Random(seed)
t0 = datetime(2026, 10, 8, 14, 30, tzinfo=timezone.utc)
orders: list[Order] = []
for n in range(14): # a cluster of sell orders cancelled within seconds, then a buy fill
placed = t0 + timedelta(minutes=2, seconds=20 * n)
orders.append(Order(f"S{n}", "TR-07", "GB00SAMPLE002", "sell", round(101.20 + 0.02 * n, 2), 5000, placed,
placed + timedelta(seconds=rng.uniform(0.4, 2.2)), 0))
orders.append(Order("B1", "TR-07", "GB00SAMPLE002", "buy", 101.05, 8000, t0 + timedelta(minutes=6), None, 8000))
for n in range(6): # ordinary activity from another trader
placed = t0 + timedelta(minutes=n * 3)
orders.append(Order(f"N{n}", "TR-19", "GB00SAMPLE002", "buy", 101.0, 1000, placed, None, 1000))
alerts = [Alert("A-1001", "layering", "TR-07", "GB00SAMPLE002", t0, t0 + timedelta(minutes=10)),
Alert("A-1002", "layering", "TR-19", "GB00SAMPLE002", t0, t0 + timedelta(minutes=20))]
history = [(rng.choice([0, 0, 0, 1, 1, 2, 3]), False) for _ in range(400)]
history += [(3, True)] * 30 + [(2, True)] * 12 + [(1, True)] * 4 + [(0, True)] * 1
return alerts, orders, {"TR-07": 1}, history
if __name__ == "__main__":
alerts, orders, escalations, history = sample_data()
rates = calibrate(history)
print({b: round(r, 3) for b, r in rates.items()})
queue = build_queue(alerts, orders, escalations, rates)
for q in queue:
print(q.alert_id, q.bucket, f"{q.p_escalation:.1%}", q.review, asdict(q.evidence))
log: list[dict[str, object]] = []
entry = record_disposition(queue[0], "analyst.m.ali", "escalate", "repeated cancels ahead of opposite fill", log)
print(entry["alert_id"], entry["decision"], entry["analyst"], str(entry["evidence_sha256"])[:12])
with open("evidence_A-1001.json", "w") as f:
json.dump(chart_payload(alerts[0], orders), f)On its sample data the run prints the calibrated escalation rate for each bucket: 1.1%, 4.0%, 18.8% and 41.9%. Alert A-1001, where one trader placed 14 sell orders that were all cancelled within about two seconds and then bought 8,000, lands in the top bucket for full review. Alert A-1002, ordinary buying by another trader, lands in batch review. The analyst escalates A-1001 and the log records the decision with a SHA-256 hash of the evidence pack.
The points are deliberately simple so an analyst can see why an alert sits where it does. If you swap them for a decision model, such as OpenAI's Decisions API covered in our deep dive on LLM classification and decision models, keep the calibration step. The queue should be ordered by what your analysts actually escalated, not by a model's confidence.
How do you chart the evidence with trading charts AI code?
The second sample is TypeScript for the analyst's screen, using Lightweight Charts 5.2.1 and the vertical-line plugin from TradingView's first official plugin packages, released on 16 September 2026 under Apache 2.0. It draws one-minute candles, every order at its own price level, fills as arrows and the alert window as two labelled lines. It reads the JSON the Python sample writes, and it passes strict type-checking with TypeScript 7.0.2.
evidence-chart.ts// Analyst evidence chart for one surveillance alert: prices, the trader's orders and the alert window.
// TypeScript 7.0.2, lightweight-charts 5.2.1, @tradingview/lwc-plugin-vertical-line 1.0.0.
// The payload comes from alert_triage.py and contains sample data only.
import {
CandlestickSeries,
createChart,
createSeriesMarkers,
LineStyle,
type AutoscaleInfo,
type IChartApi,
type SeriesMarker,
type UTCTimestamp,
} from 'lightweight-charts';
import { VerticalLine } from '@tradingview/lwc-plugin-vertical-line';
export interface EvidenceOrder {
id: string;
side: 'buy' | 'sell';
price: number;
qty: number;
time: number; // start of the one-minute bar the order was placed in, Unix seconds
cancelled: boolean;
filled: number;
}
export interface Evidence {
alert: { id: string; scenario: string; start: number; end: number };
candles: Array<{ time: number; open: number; high: number; low: number; close: number }>;
orders: EvidenceOrder[];
}
export function renderEvidence(container: HTMLElement, ev: Evidence): IChartApi {
const chart = createChart(container, {
autoSize: true,
layout: { background: { color: '#0b1224' }, textColor: '#cbd5e1' },
grid: { vertLines: { color: '#1e293b' }, horzLines: { color: '#1e293b' } },
timeScale: { timeVisible: true, secondsVisible: false },
});
// Orders resting away from the market are the evidence, so the price scale must include them.
const orderPrices = ev.orders.map((o) => o.price);
const lo = Math.min(...orderPrices);
const hi = Math.max(...orderPrices);
const prices = chart.addSeries(CandlestickSeries, {
upColor: '#26a69a', downColor: '#ef5350', wickUpColor: '#26a69a', wickDownColor: '#ef5350', borderVisible: false,
autoscaleInfoProvider: (base: () => AutoscaleInfo | null): AutoscaleInfo | null => {
const info = base();
if (info?.priceRange) {
info.priceRange.minValue = Math.min(info.priceRange.minValue, lo);
info.priceRange.maxValue = Math.max(info.priceRange.maxValue, hi);
}
return info;
},
});
prices.setData(ev.candles.map((c) => ({ ...c, time: c.time as UTCTimestamp })));
// Each order sits at its own price: grey squares for cancelled orders, blue for live ones, amber arrows for fills.
const markers: SeriesMarker<UTCTimestamp>[] = ev.orders
.map((o): SeriesMarker<UTCTimestamp> =>
o.filled > 0
? { time: o.time as UTCTimestamp, position: 'atPriceMiddle', price: o.price,
shape: o.side === 'buy' ? 'arrowUp' : 'arrowDown', color: '#f59e0b',
text: `${o.side} fill ${o.filled.toLocaleString('en-GB')}` }
: { time: o.time as UTCTimestamp, position: 'atPriceMiddle', price: o.price,
shape: 'square', color: o.cancelled ? '#94a3b8' : '#60a5fa', size: 0.6, id: o.id })
.sort((a, b) => a.time - b.time);
createSeriesMarkers(prices, markers);
// The alert window, drawn with the official vertical-line plugin released on 16 September 2026.
const edges: Array<[number, string]> = [[ev.alert.start, `${ev.alert.id} opens`], [ev.alert.end, 'window closes']];
for (const [time, label] of edges) {
prices.attachPrimitive(new VerticalLine(time as UTCTimestamp, {
color: '#fb7185', width: 2, lineStyle: LineStyle.Dashed, snap: 'nearest', showLabel: false,
badge: { text: label, color: '#ffe4e6', backgroundColor: '#2a0f16' },
}));
}
chart.timeScale().fitContent();
return chart;
}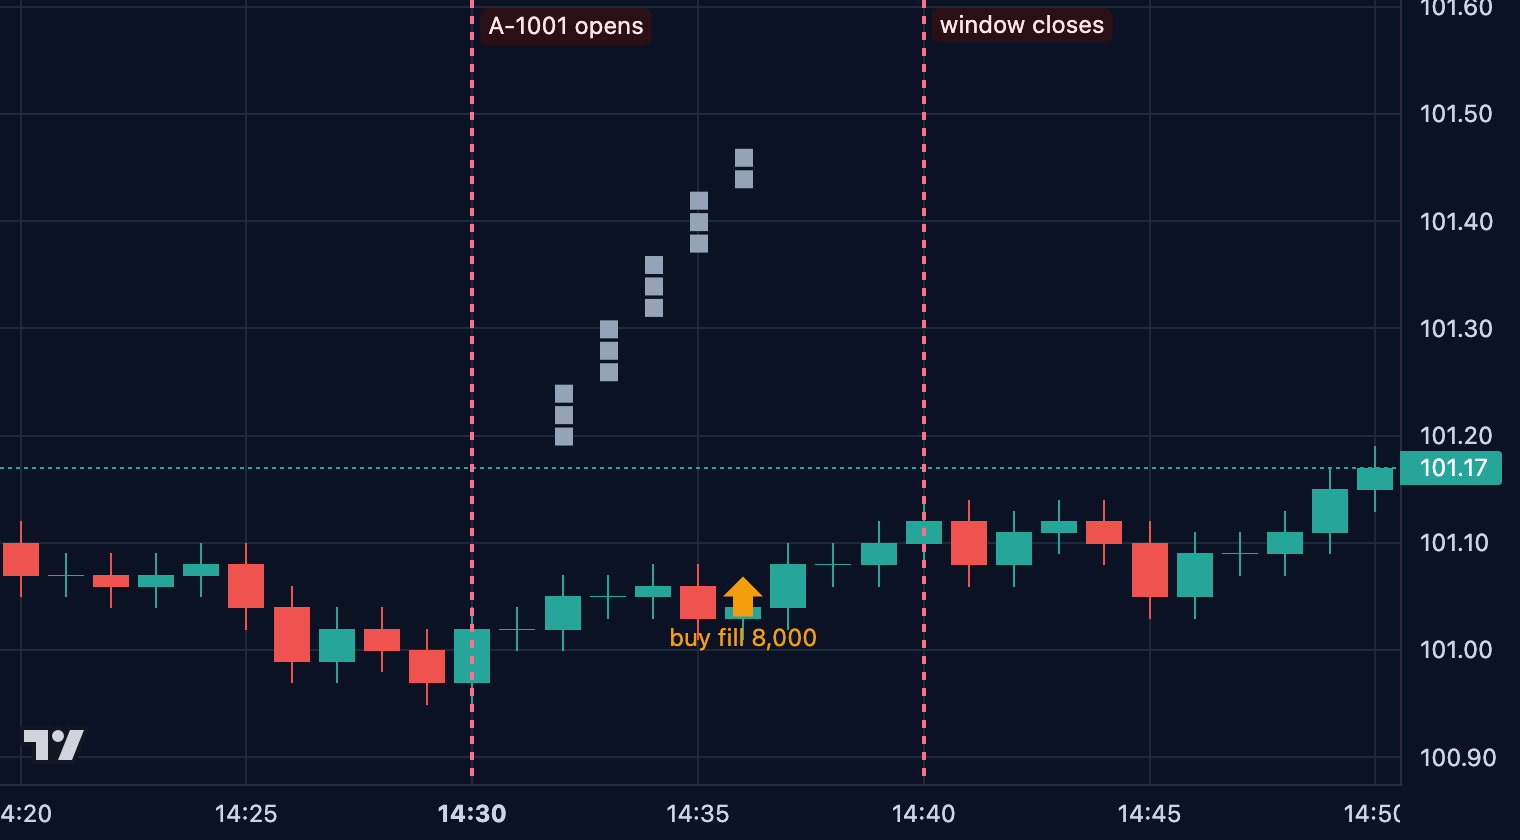
Our first render taught us something. The cancelled sell orders sat above the candles and the chart's automatic price scale cut most of them off, which hid exactly the pattern an analyst needs to see. The autoscaleInfoProvider in the sample widens the scale to include every order price. Test your evidence charts with real alert shapes before analysts rely on them.
What breaks in production?
- **History that teaches old habits.** Calibrating on past dispositions also learns past mistakes. Keep the second-review sample, track how often second reviewers overturn a closure, and run a periodic blind re-review of a random batch.
- **Volume spikes.** On volatile days alert counts jump and batch review grows. Watch queue age by bucket and add capacity before the backlog, not after.
- **Incomplete evidence.** Replica lag, missing amendments or venue clocks out of step can make an alert look harmless. Record data completeness in the evidence pack and route incomplete packs to full review.
- **Rubber-stamped batches.** If batch reviews take seconds each, the sample of second reviews will show it. Treat a rising overturn rate as an incident.
- **Time zones on the chart.** Store timestamps in UTC and display UK time, which moves between GMT and BST, with a formatter on the chart. Analysts reading the wrong hour is a real failure mode.
- **Charting licence terms.** Lightweight Charts requires the attribution notice from its NOTICE file and a link to TradingView. Its default attribution logo satisfies the link requirement, so do not switch it off unless you meet that requirement elsewhere.
Which prioritiser should you choose for trade surveillance AI?
Start with the simplest one your compliance team can explain, measure it, and only add a model when the numbers say it helps.
| Option | Strength | Watch out for |
|---|---|---|
| Vendor alert score only | No extra build | Not calibrated to your analysts' decisions |
| Transparent points plus calibration (as above) | Easy to explain to compliance and auditors | Needs re-calibration as scenarios change |
| Decision model, for example the Decisions API or a self-hosted model | Can read free text such as chat or voice transcripts | Needs calibration, residency checks and robustness testing |
| Classifier trained on past dispositions | Strong when you have years of labelled alerts | Learns historical bias, retrain with care |
| LLM narrative summary for the analyst | Saves reading time on complex alerts | A summary is not evidence, keep the raw data one click away |
How can an AI Agency London team help your surveillance desk?
Begin with the alerts your analysts spend most time on and measure today's queue age, closure time and escalation rate per scenario. Then add the evidence pack and the chart before any model, because those two save the most time with the least risk. Our AI Agency London engineers have built surveillance tooling for capital markets, and we deliver one triage workflow live, with your analysts deciding every alert, in a 14-day Proof Run. Our case studies describe the kind of operations work we do, and our blog covered how agents now fix reconciliation breaks with people approving. For the charting engine behind real-time alerts, see our playbook on building a real-time alerts engine for trading charts.
Frequently asked questions
How does trade surveillance work?
A surveillance system watches orders and trades for patterns linked to market abuse, such as layering, wash trades or trading ahead of announcements, and raises alerts. Analysts then review each alert with the underlying data and either close it with a reason or escalate it to compliance, which decides whether a suspicious transaction and order report is needed.
Can AI close trade surveillance alerts?
In the design in this playbook, no. AI builds the evidence and decides the order in which analysts see alerts. Every alert ends with a named analyst's decision, and a sample of quick closures is checked again by a second analyst. Your firm stays responsible for its surveillance arrangements.
What is alert triage in trade surveillance?
It is deciding which alerts get a full investigation first and which can be reviewed in batches. Good triage uses evidence about the alert, such as cancel ratios, order lifetimes and fills on the other side, and evidence about the past, such as how often similar alerts were escalated.
Why chart the evidence for surveillance analysts?
Because many abuse patterns are easier to judge visually. A chart showing prices, the trader's orders at their own price levels and the alert window lets an analyst see in seconds whether orders stepped away from the market and were cancelled before a fill on the other side.
References
- Financial Conduct Authority, "Building the next generation of market infrastructure (speech by Nikhil Rathi)", 22 September 2026, published 23 September 2026. https://www.fca.org.uk/news/speeches/building-next-generation-market-infrastructure
- TradingView (GitHub), "Plugin packages: 2026-09-16", 16 September 2026. https://github.com/tradingview/lightweight-charts/releases/tag/plugins-2026-09-16
- TradingView (GitHub), "Lightweight Charts v5.2.1", 12 August 2026. https://github.com/tradingview/lightweight-charts/releases/tag/v5.2.1
- jsDelivr (npm package), "@tradingview/lwc-plugin-vertical-line 1.0.0", 16 September 2026. https://www.jsdelivr.com/package/npm/@tradingview/lwc-plugin-vertical-line
- OpenAI, "Decisions (API guide)", Page checked 9 October 2026. https://developers.openai.com/api/docs/guides/decisions
- Microsoft (GitHub), "TypeScript 7.0.2 release", Published to npm 8 July 2026, release notes 20 August 2026. https://github.com/microsoft/TypeScript/releases/tag/v7.0.2