Trading · BraivIQ AI Engineering Playbook
Trading Dashboard Charts: Price Line Hit-Testing And Date Checks In Lightweight Charts 5.3
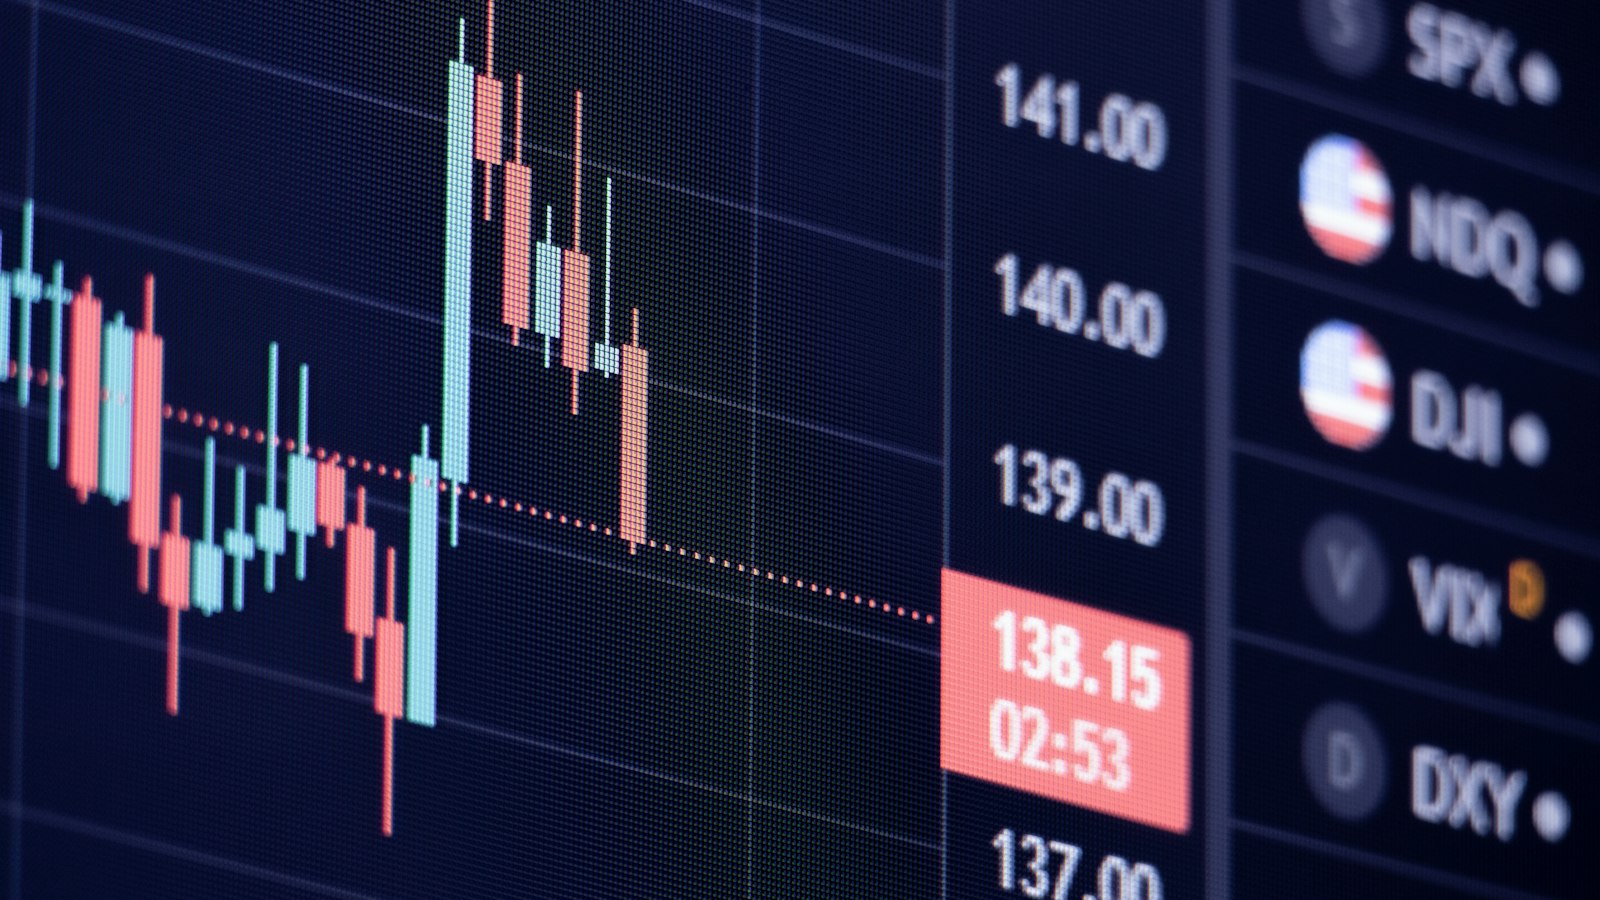
Trading dashboard charts need two things before anyone trusts them: hovers that land on the right line and dates that plot on the right day. Lightweight Charts 5.3.0, released on 10 November 2026, adds a hitTestTolerance option to price lines and now throws on business day strings that are not zero-padded YYYY-MM-DD in every build. The release notes say the production build previously skipped that check, so users in timezones ahead of UTC could see points plotted a day early. This guide shows a TypeScript review chart with sample data, a date-cleaning step and where the person signs off.
Published · Updated · 7 min read · By BraivIQ Engineering
Key takeaways
- Lightweight Charts 5.3.0 was released on 10 November 2026.
- A new hitTestTolerance option on PriceLineOptions sets how many pixels beyond a price line still count as a hover. The default stays at 7, the old fixed value.
- Business day strings must now be zero-padded YYYY-MM-DD in all builds. Before 5.3.0 the production build skipped the check, and strings such as 2024-1-5 could plot a day early for users ahead of UTC.
- Curved lines now use the Fritsch-Carlson monotone algorithm, so they no longer overshoot neighbouring points but look slightly different.
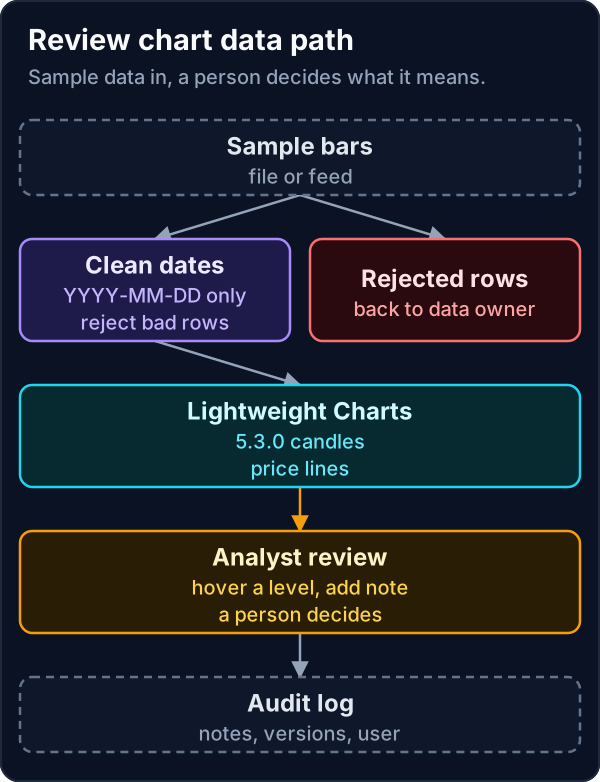
- Clean dates before they reach the chart, send rejected rows back to the data owner and keep every analyst note in an audit log.
Trading dashboard charts are the screens where operations and risk teams look at prices, reference levels and exceptions. This guide uses sample data only and contains no trading signals or advice. It covers what changed in Lightweight Charts 5.3.0 and how to build a review chart that a person can trust and sign off.
What changed in Lightweight Charts 5.3.0?
TradingView released Lightweight Charts 5.3.0 on 10 November 2026. The release notes list two enhancements and a set of bug fixes. Three items matter for a review dashboard.
- **Price line hit-testing.** A new hitTestTolerance option on PriceLineOptions controls how many pixels beyond a price line's stroke still count as a hit when hovering. It was previously fixed at 7 pixels, so closely stacked price lines could register hovers for their neighbours. The default stays at 7.
- **Curved lines.** LineType.Curved now uses the Fritsch-Carlson monotone algorithm instead of Catmull-Rom interpolation. Curves no longer overshoot neighbouring values, so flat sections stay flat, but curved lines will look slightly different from earlier versions.
- **Business day strings.** Strings must be zero-padded YYYY-MM-DD in all builds. The production build previously skipped the format check that the development build performs, and the browser parsed strings such as 2024-1-5, 2024/01/05 or Jan 5 2024 as local time. For users in timezones ahead of UTC, those points plotted one day early. Such strings now throw an error in every build.
The third change is the one that will surface first. A dashboard that has worked for months on loosely formatted dates will throw after the upgrade. That is the right outcome, because the old behaviour was quietly wrong for some users.
Why do date formats matter on a review chart?
A one-day shift on a chart is not cosmetic. If an analyst compares a price spike with a booking date and the chart puts the spike a day early, the note they write is wrong. On a desk with staff in London and Singapore, two people looking at the same data could see different days.
The release notes give the fix: zero-pad strings to YYYY-MM-DD or pass a BusinessDay object with year, month and day. Do that in a cleaning step before the chart, and reject anything you cannot parse rather than guessing.
businessDays.ts// Clean sample bar dates before they reach Lightweight Charts 5.3.0, which now
// throws on business day strings that are not zero-padded YYYY-MM-DD in all builds.
// Node 22.20 with --experimental-strip-types, TypeScript 5.9.
type RawBar = { date: string; open: number; high: number; low: number; close: number };
type Bar = Omit<RawBar, 'date'> & { time: string };
const ISO = /^\d{4}-\d{2}-\d{2}$/;
const LOOSE = /^(\d{4})[-/](\d{1,2})[-/](\d{1,2})$/;
function checkCalendar(s: string): string {
const d = new Date(`${s}T00:00:00Z`);
if (Number.isNaN(d.getTime()) || d.toISOString().slice(0, 10) !== s) {
throw new Error(`not a real date: ${s}`);
}
return s;
}
export function toBusinessDay(raw: string): string {
const s = raw.trim();
if (ISO.test(s)) return checkCalendar(s);
const m = LOOSE.exec(s);
if (!m) throw new Error(`unrecognised format: ${raw}`);
return checkCalendar(`${m[1]}-${m[2].padStart(2, '0')}-${m[3].padStart(2, '0')}`);
}
export function cleanBars(rows: RawBar[]): { bars: Bar[]; rejected: string[] } {
const bars: Bar[] = [];
const rejected: string[] = [];
const seen = new Set<string>();
for (const r of rows) {
try {
const time = toBusinessDay(r.date);
if (seen.has(time)) throw new Error(`duplicate bar: ${time}`);
if (r.low > Math.min(r.open, r.close) || r.high < Math.max(r.open, r.close)) {
throw new Error(`high or low outside open and close: ${time}`);
}
seen.add(time);
bars.push({ time, open: r.open, high: r.high, low: r.low, close: r.close });
} catch (e) {
rejected.push((e as Error).message);
}
}
bars.sort((a, b) => a.time.localeCompare(b.time)); // the chart needs ascending time
return { bars, rejected };
}
const sample: RawBar[] = [
{ date: '2026-11-03', open: 100.6, high: 101.1, low: 100.4, close: 100.9 },
{ date: '2026-11-4', open: 100.9, high: 101.3, low: 100.7, close: 101.0 },
{ date: '2026/11/05', open: 101.0, high: 101.4, low: 100.8, close: 101.2 },
{ date: 'Nov 6 2026', open: 101.2, high: 101.5, low: 100.9, close: 101.1 },
{ date: '2026-11-31', open: 101.1, high: 101.2, low: 100.6, close: 100.7 },
{ date: '2026-11-04', open: 101.0, high: 101.2, low: 100.9, close: 101.1 },
];
const { bars, rejected } = cleanBars(sample);
console.log(bars.map((b) => b.time).join(', '));
console.log(rejected.join('\n'));TypeScript 5.9, run once with Node 22.20 and --experimental-strip-types. Sample bars only. It pads 2026-11-4 and 2026/11/05, rejects Nov 6 2026 and the impossible 2026-11-31, and catches a duplicate bar.
The sample also checks that high and low bracket the open and close, rejects duplicates and sorts ascending, because the chart expects ordered time. Rejected rows go back to whoever owns the feed, with the reason.
How do you build trading dashboard charts with close price lines?
Review screens often show several levels close together, such as a reference price with a check band either side. With the old fixed 7-pixel tolerance, hovering one could highlight its neighbour. In 5.3.0 you can set hitTestTolerance on each price line.
priceLines.ts// Lightweight Charts 5.3.0 (released 10 November 2026), TypeScript 5.9.
// Review levels on a sample candlestick chart. Sample data only, not signals.
import { createChart, CandlestickSeries, LineStyle } from 'lightweight-charts';
import type { CandlestickData, IPriceLine, MouseEventParams, Time } from 'lightweight-charts';
type Level = { id: string; price: number; title: string; colour: string };
// Closely stacked levels: the case the new hitTestTolerance option is for.
const LEVELS: Level[] = [
{ id: 'check-high', price: 101.2, title: 'Price check high', colour: '#f59e0b' },
{ id: 'reference', price: 101.0, title: 'Reference price', colour: '#38bdf8' },
{ id: 'check-low', price: 100.8, title: 'Price check low', colour: '#f59e0b' },
];
export function mountReviewChart(
el: HTMLElement,
bars: CandlestickData<Time>[],
onHover: (levelId: string | null) => void,
): () => void {
const chart = createChart(el, {
height: 360,
layout: { background: { color: '#0b1224' }, textColor: '#cbd5e1' },
});
const series = chart.addSeries(CandlestickSeries);
series.setData(bars);
const lines: IPriceLine[] = LEVELS.map((l) =>
series.createPriceLine({
id: l.id,
price: l.price,
color: l.colour,
lineWidth: 2,
lineStyle: LineStyle.Dashed,
axisLabelVisible: true,
title: l.title,
hitTestTolerance: 2, // pixels, the default stays at 7
}),
);
const handler = (p: MouseEventParams<Time>) => {
const id = typeof p.hoveredObjectId === 'string' ? p.hoveredObjectId : null;
onHover(LEVELS.some((l) => l.id === id) ? id : null);
};
chart.subscribeCrosshairMove(handler);
return () => {
chart.unsubscribeCrosshairMove(handler);
lines.forEach((l) => series.removePriceLine(l));
chart.remove();
};
}Lightweight Charts 5.3.0 and TypeScript 5.9, type-checked once in strict mode. Three sample review levels sit 0.2 apart, with hitTestTolerance set to 2 pixels so a hover lands on the intended line. The crosshair handler reports the hovered level ID.
The hovered level ID feeds a side panel where the analyst writes a note. That note, the data version and the analyst's name go to the audit log. Nothing on the chart changes a booking or a limit. Any action goes through an approval step outside the chart.
Where does AI fit on a review chart?
An agent can prepare the context around a chart: which bookings fall near a level, which exceptions opened that day and a draft note. It should not draw conclusions about where a price will go. Our earlier playbook on AI trading charts with annotations and provenance shows how to mark which notes an agent drafted and which a person wrote.
Keep the agent's output in the side panel, labelled as a draft, with an approve button that records the reviewer. The chart stays a view of data, and the person decides what it means.
What breaks in production?
- **The upgrade throws.** Feeds with dates like 2026-11-4 or 2026/11/05 now throw in production builds. Run the cleaning step against a month of real data before upgrading.
- **Curves look different.** Users who compare screenshots across versions will see changed curves. Show the library version in the screen footer and record it in the audit log.
- **Timezones.** Timestamps and business days behave differently. Decide which your desk uses and convert at the source.
- **Over-tight tolerance.** A tolerance of 0 or 1 pixel makes lines hard to hover on touch screens. Test on the devices your team uses.
- **Silent dedupe.** Dropping duplicate bars without telling anyone hides a feed problem. Report every rejection.
What are the trade-offs and alternatives?
Passing BusinessDay objects avoids string parsing entirely but spreads date logic through your code. Cleaning strings once at the edge keeps the chart code simple. Unix timestamps suit intraday data, while business days suit end-of-day review.
Larger charting libraries offer more chart types and built-in annotation tools, at the cost of bundle size and licence terms. For a focused review screen, Lightweight Charts with a small cleaning layer is usually enough. As an AI Automation London team we pick the lighter option unless the desk needs more.
Where should a team start?
Pin Lightweight Charts to 5.3.0, run the date cleaner across your feeds and fix rejections at source before the upgrade reaches users. Our article on CHAPS settlement hours shows why date handling is getting more attention in payments too. Workflow Automation London clients often pair this with trade allocations and confirmations, and a 14-day Proof Run can put a review screen on your own sample data. This guide uses sample data only and is not investment advice.
Frequently asked questions
What is new in Lightweight Charts 5.3.0?
Released on 10 November 2026, it adds a hitTestTolerance option to price lines, switches curved lines to the Fritsch-Carlson monotone algorithm and requires zero-padded YYYY-MM-DD business day strings in all builds.
Why does my chart throw after upgrading to 5.3.0?
Business day strings that are not zero-padded YYYY-MM-DD now throw in production builds as well as development builds. Zero-pad them or pass a BusinessDay object with year, month and day.
What does hitTestTolerance do?
It sets how many pixels beyond a price line's stroke still count as a hover. The default is 7, which matches the fixed value used before 5.3.0.
Can an AI agent annotate trading charts?
An agent can draft context notes for a person to review, labelled as drafts. It should not produce trading signals, and any action should go through an approval step outside the chart.
References
- TradingView on GitHub, "Lightweight Charts v5.3.0 release notes", 10 November 2026. https://github.com/tradingview/lightweight-charts/releases/tag/v5.3.0