Trading · BraivIQ AI Engineering Playbook
Trading Automation For Surveillance Settings: Above And Below The Line Testing After Market Watch 86
Trading automation for surveillance is not only about raising alerts. It is about proving the settings behind them work. On 14 October 2026 the FCA's Market Watch 86 described retail brokers using a flat price move threshold whatever the instrument's volatility, and a minimum notional so high that client trades were never monitored. It named above and below the line testing and synthetic trade data as good practice. This playbook builds that test in Python, charts the result with Lightweight Charts in TypeScript, and puts a named owner and a calibration log in front of any change to a live setting.
Published · Updated · 12 min read · By BraivIQ Engineering

Key takeaways
- Market Watch 86, published on 14 October 2026, found firms relying on vendor default settings, flat price move thresholds and minimum notional values set so high that client trades were not monitored.
- The FCA named testing alerts at different thresholds through above and below the line testing, and synthetic trade data, as good practice.
- In the sample, a flat 2% move with a £50,000 minimum misses 80 of 120 cases built to alert. Lowering the minimum catches them all but adds false alerts. A threshold scaled to volatility does best, partly because the synthetic data was built that way.
- Treat a setting change like a code change: test evidence, a chart, a named approver and a calibration log.
7 - Retail brokers the FCA visited for Market Watch 86 (14 October 2026) · 80 of 120 - Synthetic cases built to alert that a flat 2% move with a £50k minimum missed in the sample · 240 - Synthetic cases in the test, across two instruments and three trade sizes · 0 - Real trades, prices or signals used. Synthetic data only.
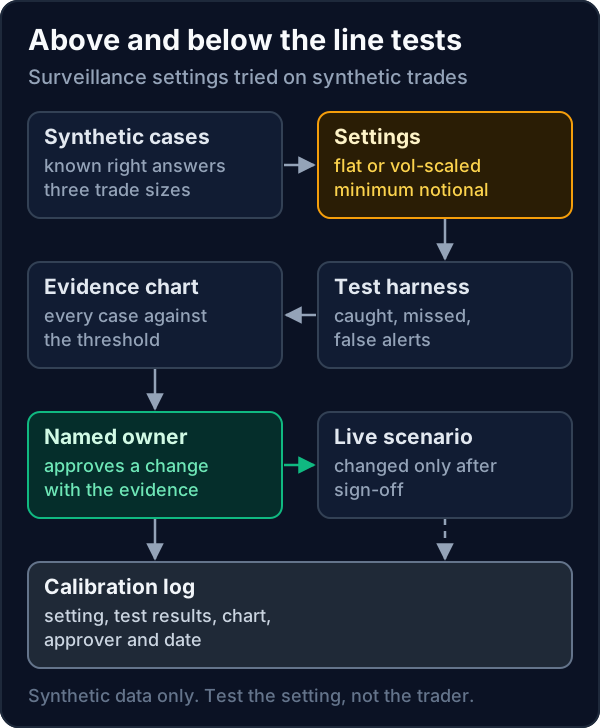
Use trading automation to test the settings, not only to run them. Build synthetic cases whose right answer you know, run every candidate setting against them, count what each one catches, misses and falsely raises, and show the result to the person who owns the scenario. Change a live setting only after that person signs off, and keep the evidence. This is engineering for surveillance testing. It contains no trading signals or strategies, and every number comes from synthetic data.
The Python sample uses only the standard library and passes mypy 2.4.0 in strict mode on Python 3.14.4 and 3.11.14. The chart uses lightweight-charts 5.2.1 and passes TypeScript 7.0.2 in strict mode.
What did Market Watch 86 find?
The FCA visited 7 retail brokers. Some “appeared to rely on out-of-the-box settings provided by third-party vendors”, and some “mistakenly assumed that having an alert in place was evidence of an effective control”. It found a “flat price move threshold” applied regardless of large-cap or small-cap volatility and a “minimum notional trade value parameter that was set too high”. As good practice it named “testing alerts at different thresholds through ‘above’ and ‘below the line’ testing” and “using synthetic trade data to test whether alerts would trigger as expected in specific market abuse scenarios”. Our blog covered what Market Watch 86 means for brokers.
What does trading automation for threshold testing look like?
calibration.py"""Above and below the line testing for a surveillance scenario, with synthetic trades.
FCA Market Watch 86 (14 October 2026) found retail brokers using a flat price move threshold regardless of
large-cap or small-cap volatility, and a minimum notional so high that client trades were never
monitored. It names "above" and "below the line" testing and synthetic trade data as good practice.
The scenario here is a deliberately simple example (a trade followed by a large price move), not a
vendor rule and not a detection method to copy. The point is the test harness: generate cases whose
right answer you know, run each candidate setting, and count what it catches and what it misses.
Standard library only. Tested on Python 3.14.4 and 3.11.14 with mypy --strict. Synthetic data only.
"""
from __future__ import annotations
import json
import random
from dataclasses import asdict, dataclass
from pathlib import Path
from typing import Literal
Label = Literal["test_positive", "test_negative"]
@dataclass(frozen=True)
class Instrument:
name: str
daily_vol_pct: float # used only to generate synthetic moves
@dataclass(frozen=True)
class Case:
time: int # UTC seconds, for the chart
instrument: str
notional_gbp: float
move_pct: float
label: Label # what the case was built to be
@dataclass(frozen=True)
class Setting:
name: str
min_notional_gbp: float
flat_move_pct: float | None = None # a single threshold for every instrument
vol_multiple: float | None = None # or a threshold scaled to each instrument's volatility
def alerts(self, case: Case, vol: dict[str, float]) -> bool:
if case.notional_gbp < self.min_notional_gbp:
return False
limit = self.flat_move_pct if self.flat_move_pct is not None else (self.vol_multiple or 0) * vol[case.instrument]
return abs(case.move_pct) >= limit
# Test positives: a move of 3 to 5 daily volatilities after the trade. Test negatives: under 1.
BUCKETS: tuple[tuple[Label, float, float], ...] = (("test_positive", 3.0, 5.0), ("test_negative", 0.1, 1.0))
def synthetic_cases(instruments: list[Instrument], per_bucket: int, seed: int = 7) -> list[Case]:
"""Each instrument gets positives and negatives at retail, larger retail and institutional sizes."""
rng = random.Random(seed)
cases: list[Case] = []
t = 1_790_000_000
for inst in instruments:
for notional in (2_500.0, 15_000.0, 80_000.0): # retail, larger retail, institutional size
for _ in range(per_bucket):
for label, lo, hi in BUCKETS:
move = round(rng.uniform(lo, hi) * inst.daily_vol_pct * rng.choice((-1, 1)), 2)
cases.append(Case(t, inst.name, notional, move, label))
t += 60
return cases
@dataclass(frozen=True)
class Result:
setting: str
caught: int
missed: int
false_alerts: int
missed_by_instrument: dict[str, int]
def run(setting: Setting, cases: list[Case], vol: dict[str, float]) -> Result:
caught = missed = false_alerts = 0
by_inst: dict[str, int] = {}
for c in cases:
fired = setting.alerts(c, vol)
if c.label == "test_positive" and fired:
caught += 1
elif c.label == "test_positive":
missed += 1
by_inst[c.instrument] = by_inst.get(c.instrument, 0) + 1
elif fired:
false_alerts += 1
return Result(setting.name, caught, missed, false_alerts, by_inst)
if __name__ == "__main__":
instruments = [Instrument("LARGECAP", 1.2), Instrument("SMALLCAP", 4.5)]
vol = {i.name: i.daily_vol_pct for i in instruments}
cases = synthetic_cases(instruments, per_bucket=20)
settings = [
Setting("flat 2% move, min notional £50k", min_notional_gbp=50_000, flat_move_pct=2.0),
Setting("flat 2% move, min notional £1k", min_notional_gbp=1_000, flat_move_pct=2.0),
Setting("3x volatility, min notional £1k", min_notional_gbp=1_000, vol_multiple=3.0),
]
positives = sum(c.label == "test_positive" for c in cases)
print(f"{len(cases)} synthetic cases, {positives} built to alert")
for s in settings:
r = run(s, cases, vol)
print(f"{r.setting:<34} caught {r.caught:>3} missed {r.missed:>3} false alerts {r.false_alerts:>3} "
f"missed by instrument {r.missed_by_instrument}")
chosen = settings[0]
rows = [{**asdict(c), "alerted": chosen.alerts(c, vol)} for c in cases if c.instrument == "SMALLCAP"]
Path("calibration.json").write_text(json.dumps({"setting": chosen.name, "threshold_pct": 2.0, "cases": rows}))
print(f"wrote calibration.json with {len(rows)} SMALLCAP cases for the chart")Standard library only. Tested on Python 3.14.4 and 3.11.14 with mypy 2.4.0 --strict. Synthetic data.
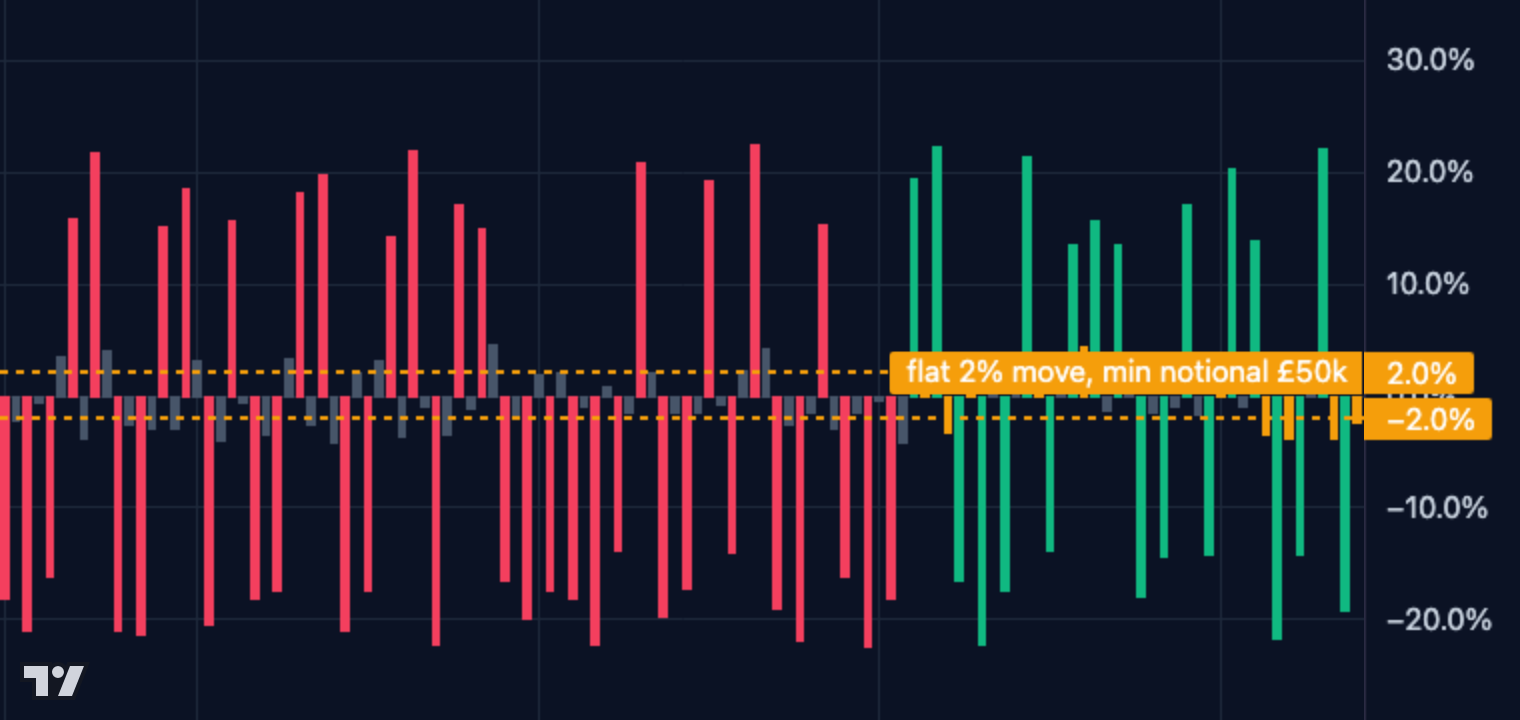
With 240 cases, 120 built to alert, a flat 2% move with a £50,000 minimum catches 40 and misses 80: every retail-sized case is invisible, and large-cap moves below 2% are missed too. Dropping the minimum to £1,000 catches all 120 but raises 35 false alerts on volatile small-cap stock. A threshold of three times each instrument's volatility catches all 120 with none false. Be honest about why: the synthetic generator built positives at 3 to 5 volatilities and negatives below 1, so that setting is right by construction. Real calibration needs scenarios designed by your surveillance team.
How do you show the evidence to the scenario owner?
One bar per synthetic case, coloured by outcome, with the threshold drawn across it. Red bars are cases that should alert and did not, which is the below the line problem in one picture.
calibration_chart.ts// Calibration chart for surveillance testing: every synthetic case as a bar of its price move, coloured by
// what the scenario did with it, against the threshold line. Reads calibration.json from calibration.py.
// lightweight-charts 5.2.1, TypeScript 7.0.2 (strict). Synthetic data only.
import { createChart, HistogramSeries, LineStyle, type HistogramData, type UTCTimestamp } from 'lightweight-charts';
interface CalibrationCase {
time: number;
instrument: string;
notional_gbp: number;
move_pct: number;
label: 'test_positive' | 'test_negative';
alerted: boolean;
}
interface CalibrationRun {
setting: string;
threshold_pct: number;
cases: CalibrationCase[];
}
const COLOURS = {
caught: '#10b981', // built to alert, and it did
missed: '#f43f5e', // built to alert, and it did not: the "below the line" problem
falseAlert: '#f59e0b', // built not to alert, and it did
quiet: '#475569', // built not to alert, and it did not
} as const;
function colour(c: CalibrationCase): string {
if (c.label === 'test_positive') return c.alerted ? COLOURS.caught : COLOURS.missed;
return c.alerted ? COLOURS.falseAlert : COLOURS.quiet;
}
export function renderCalibration(container: HTMLElement, run: CalibrationRun): void {
const chart = createChart(container, {
height: 360,
layout: { background: { color: '#0b1224' }, textColor: '#cbd5e1', fontSize: 15 },
grid: { vertLines: { color: '#1e293b' }, horzLines: { color: '#1e293b' } },
timeScale: { visible: false }, // synthetic timestamps only order the cases
});
const series = chart.addSeries(HistogramSeries, {
priceFormat: { type: 'percent' },
base: 0,
lastValueVisible: false,
priceLineVisible: false,
});
const data: HistogramData<UTCTimestamp>[] = run.cases.map((c) => ({
time: c.time as UTCTimestamp,
value: c.move_pct,
color: colour(c),
}));
series.setData(data);
for (const sign of [1, -1]) {
series.createPriceLine({
price: sign * run.threshold_pct,
color: '#f59e0b',
lineStyle: LineStyle.Dashed,
lineWidth: 2,
axisLabelVisible: true,
title: sign === 1 ? run.setting : '',
});
}
chart.timeScale().fitContent();
const missed = run.cases.filter((c) => c.label === 'test_positive' && !c.alerted).length;
container.setAttribute('aria-label', `${run.cases.length} synthetic cases, ${missed} missed by ${run.setting}`);
}
async function main(): Promise<void> {
const response = await fetch('calibration.json');
const run = (await response.json()) as CalibrationRun;
const container = document.getElementById('chart');
if (container === null) throw new Error('missing #chart element');
renderCalibration(container, run);
}
void main();lightweight-charts 5.2.1, TypeScript 7.0.2 strict, bundled with esbuild 0.28.2. Reads calibration.json from calibration.py.
What breaks in production?
- **Synthetic data that flatters a setting.** As above, the generator can decide the answer. Have scenarios written by people who know the abuse type, not by the person tuning the threshold.
- **Volatility measured badly.** A volatility-scaled threshold is only as good as the volatility estimate. Test thin and newly listed stocks separately.
- **Alert volume used as proof.** The FCA called out comparing alert volumes to trading volumes. Count caught and missed test cases instead.
- **Settings changed without a record.** Keep the setting, test results, chart, approver and date together, and review them on a schedule.
What are the alternatives to building your own test rig?
| Option | Good fit | Trade-off |
|---|---|---|
| Vendor calibration tools | Firms on a surveillance platform with built-in testing | Check the tool tests your settings, not only the vendor defaults |
| Historical replay only | Firms with long, clean trade history | Shows what fired, not what should have, so misses stay hidden |
| Synthetic tests, as above | Any firm, and good for below the line testing | Scenario design takes surveillance expertise |
Where should a broker start?
Write down the current settings for each scenario, generate synthetic cases around them at retail and institutional sizes, and count the misses. That one table answers the Market Watch 86 question: were your settings tested? Our trade surveillance alert triage playbook covers the queue after alerts fire, and our case studies include real-time surveillance for a global investment bank, where people made the call on what each alert meant. Our AI Agency London team can build the test rig with your surveillance team in a 14-day Proof Run.
Frequently asked questions
What is above and below the line testing?
It is testing a surveillance scenario with cases just above and just below its thresholds, to see whether it alerts when it should and stays quiet when it should. The FCA named it as good practice in Market Watch 86 on 14 October 2026.
Why use synthetic trade data for surveillance testing?
Because you know the right answer for each case. Historical data shows what alerted, not what should have, so missed abuse stays hidden. Synthetic cases let you count misses directly, as long as the scenarios are designed by people who know the behaviour.
Does this playbook contain trading strategies or signals?
No. It is engineering for testing surveillance settings. All prices, trades and instruments are synthetic, and nothing here suggests what to buy or sell.
References
- Financial Conduct Authority, "Market Watch 86", 14 October 2026. https://www.fca.org.uk/publications/newsletters/market-watch-86
- TradingView (GitHub), "Lightweight Charts releases", 2026. https://github.com/tradingview/lightweight-charts/releases
- jsDelivr, "lightweight-charts 5.2.1 package", 2026. https://www.jsdelivr.com/package/npm/lightweight-charts?version=5.2.1
- Financial Conduct Authority, "Three arrests in major FCA operation against criminal insider dealing ring", 13 October 2026. https://www.fca.org.uk/news/press-releases/three-arrests-major-fca-operation-against-criminal-insider-dealing-ring